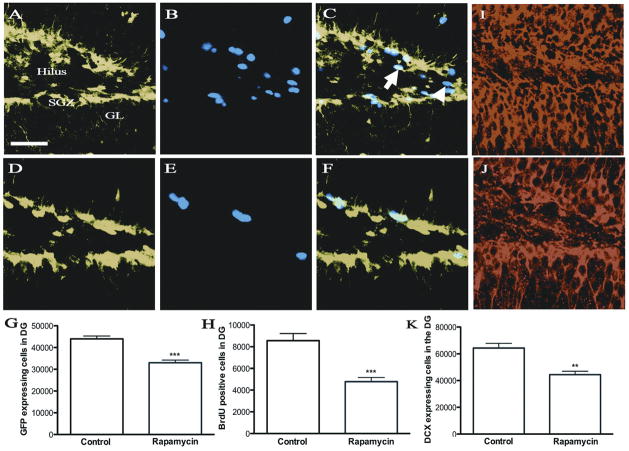
Figure 5. Changes in the progenitor cell population within the DG at P14 following rapamycin injection.
Representative pictures of GFP, BrdU and DCX expression in DG from mice under control (A, B, I) and rapamycin-treated conditions (D, E, J) respectively, showing significantly decreased numbers of GFP-positive (G), BrdU-positive cells (H) and DCX-positive cells (K) with rapamycin treatment as quantified by design-based stereology. The merged picture for control (C) and rapamycin treated (F) shows BrdU-positive cells that are co-localized (arrow) and ones that are not (arrowhead). P-values for GFP, BrdU and DCX are significant. **P < 0.001. Error bars represent standard deviation and scale bars represent 35 μM.

