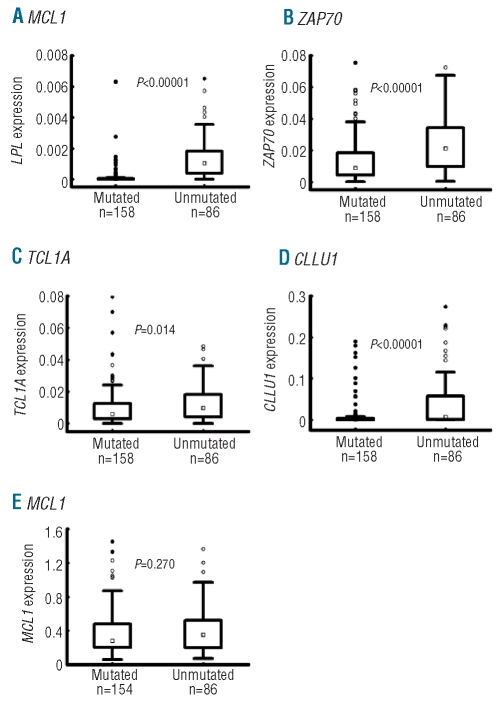
Figure 3.
The expression levels of RNA-based markers in relation to IGHV mutation status. Box plots depict the expression levels of (A) LPL, (B) ZAP70, (C) TCL1A, (D) CLLU1 and (E) MCL1 within CLL cases carrying mutated and unmutated IGHV genes. The box plots show median, 25 and 75 percentile values, non-outlier ranges, outliers and extremes. P values are derived from Student’s t-test.

