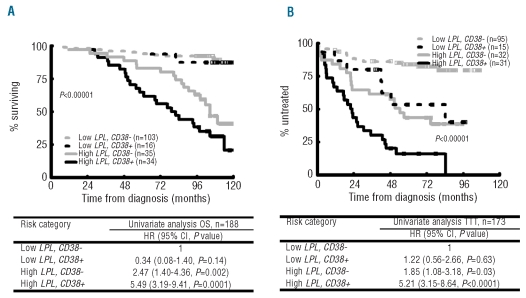
Figure 5.
LPL and CD38 expression status subdivides overall survival and time to treatment in the Binet A subgroup. Kaplan-Meier curves analysis of overall survival (A) and time to treatment (B) within the Binet A subgroup of patients according to LPL and CD38 expression status. Cox’s univariate analysis indicates hazard ratios (HR) for different marker combinations for overall survival and time to treatment analysis. The threshold values used in the analysis are as follows; LPL threshold value based on ROC curve analysis; CD38: 7%.

