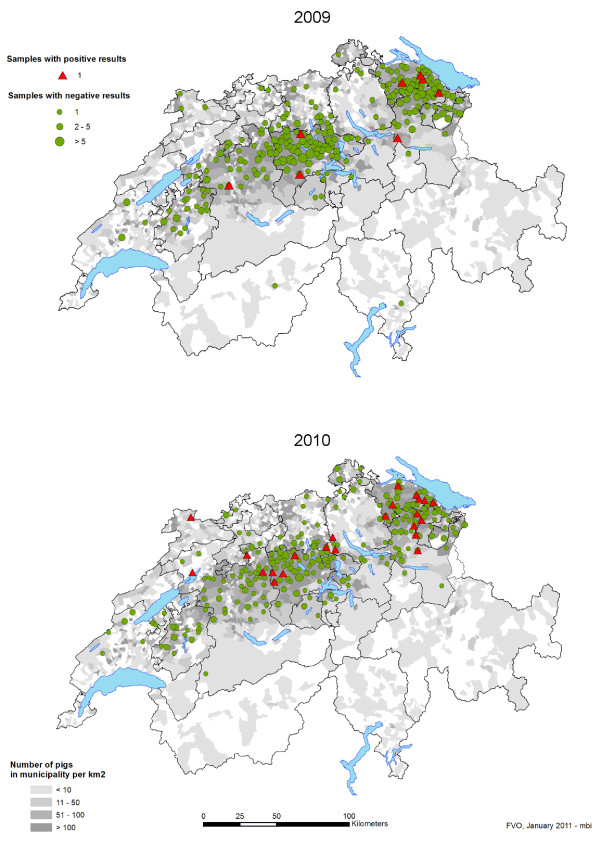
Figure 1.
Pig density and geographical distribution of the samples and results for MRSA isolated from the nasal cavities of slaughter pigs in Switzerland in 2009 and 2010. The pig density appears in grey. Samples with positive results appear as red triangles, samples with negative results appear as green dots.

