
Figure 2.
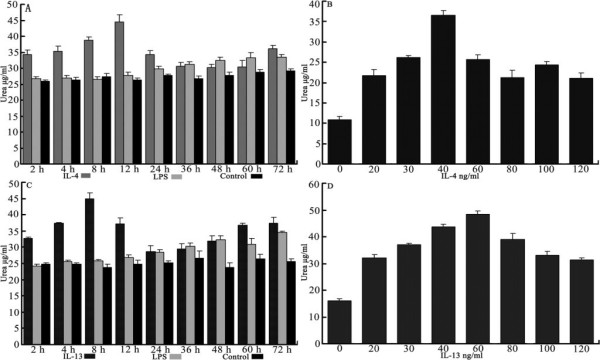
Urea production of RAW 264.7 cells by IL-4 or IL-13. RAW cells were exposed to 0 ng/mL, 30 ng/mL LPS, 30 ng/mL IL-4 (see Figure 2A) or 30 ng/mL IL-13 (see Figure 2C). At scheduled time points, the cells were collected for urea determination using a microplate method. RAW 264.7 cells were exposed to IL-4 for 12 h (see Figure 2B) or IL-13 for 8 h (see Figure 2D) at different concentrations, then urea was measured. Values are averages ± SD of two independent experiments each done in triplicates; (*) indicates p < 0.05, (**) indicates p < 0.01 (one way ANOVA).