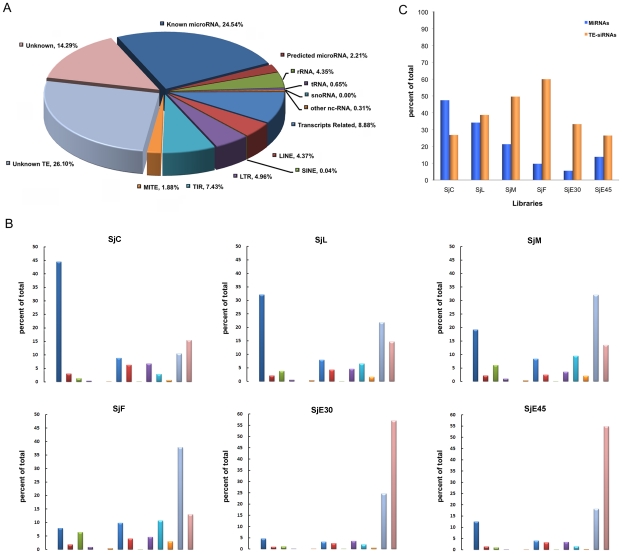
Figure 1. Classification and percentage of S. japonicum sncRNA.
A. Classification and percentage of S. japonicum sncRNA using mixed small RNA data from all stages sequenced. MiRNAs took up more than 25% of total small RNAs. TE-siRNAs were mainly derived from LTR, LINE, TIR, and MITE, and accounted for approximately 45% of total small RNAs (including those from unknown TEs). B. Classification and percentage of S. japonicum sncRNA from different developmental stages. C. The percentage of miRNAs and TE-siRNAs during different developmental stages. The ratio of siRNA to miRNA was gradually increased and accumulated to the top in female worms and early deposited eggs. Note that the color scheme used in section B was the same as section A.

