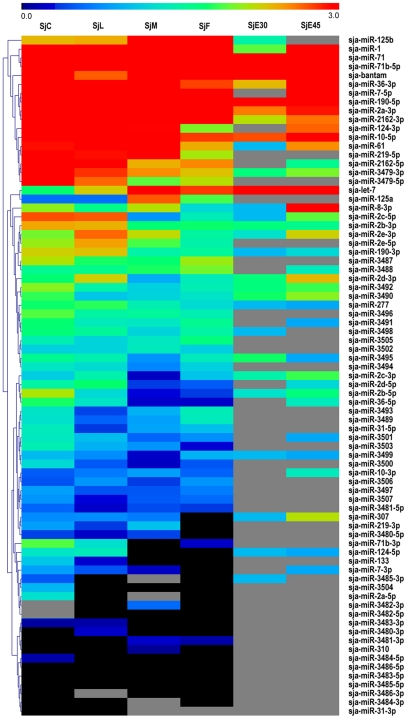
Figure 3. Hierarchical clustering of the known miRNAs during different developmental stages using Pearson correlation.
Heatmap was constructed based on the log10 of TPM value of miRNAs. Black indicated the expression value of the miRNA was 0 after normalization. Grey indicated that the miRNA was not detected in that library. TPM value for each tag was calculated by the sum of total clean reads which were within±2 bp variations of the mature miRNAs on the precursor.

