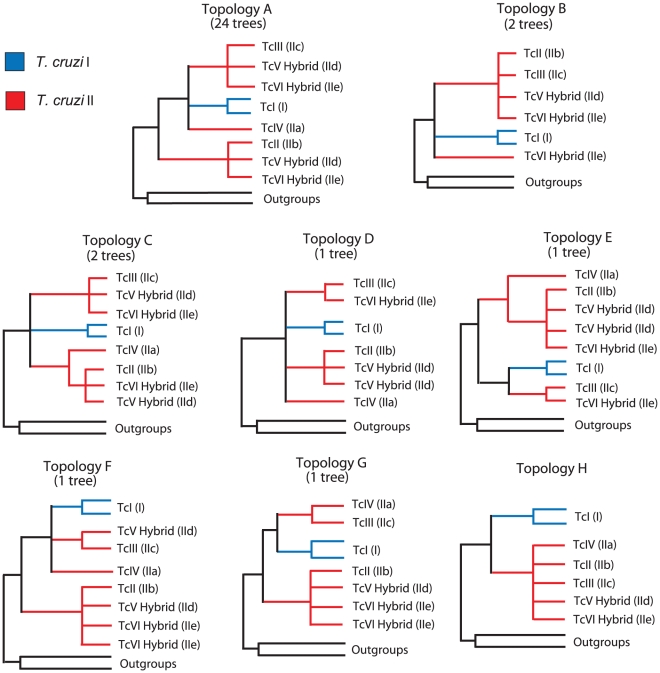
Figure 1. Phylogenetic topologies obtained from the 32 analyzed loci.
Number on top of each topology represents the number of times that particular topology was observed (Table 2). All internal branches shown had bootstrap support values >70%. The topologies are depicted with respect to the classification system that divides T. cruzi in two major lineages [30], T. cruzi I (blue) and T. cruzi II (red), and the six major DTUs are labeled. Topology H is consistent with the current classification, and represents a history of divergence in which T. cruzi I and II are reciprocally monophyletic.

