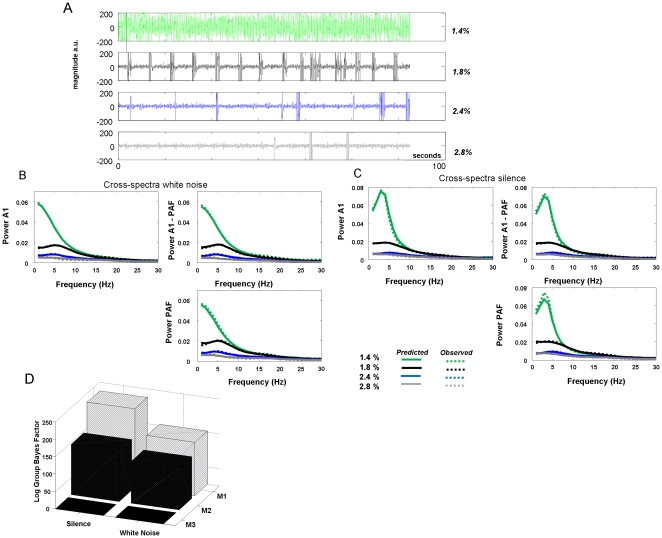
Figure 3. Modelled Data.
A Time series recording from one animal in the noise condition showing increased burst suppression with increasing isoflurane dose. B Average cross-spectral density matrix representing spectral responses with prominent low frequency components for four isoflurane dose levels (Hashed line: 1.4%: green, 1.8%: black, 2.4%: blue, 2.8%: grey) as rats heard a white noise stimulus. Significant differences in spectral power are found for LFP recordings from A1 and PAF and also for their cross-spectra (off-diagonal term). Fits from model 1, averaged across animals are shown as full lines. C Average cross-spectra as per B, but for recordings and subsequent fits from the silent environment. D Log-evidence differences at the group level (relative to worse performing model M3: LL), showing very strong evidence in favour of model 1 (M1: FB) for both noisy and silent environments.

