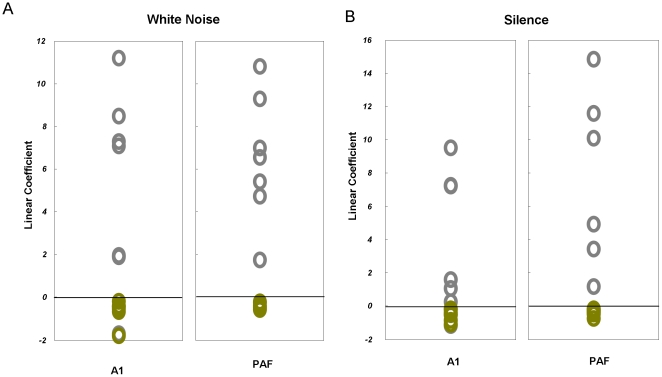
Figure 5. Dose Response Curves.
A Linear components of polynomial fits for each animal individually in noise conditions for regions A1 and PAF, using a linear regression to describe the dose response of (conditional) EPSP effects (green) and using a second order function to describe the dose response of (conditional) IPSP effects (grey). B Linear components of polynomial fits for each animal individually during silence, for regions A1 and PAF obtained as per A.

