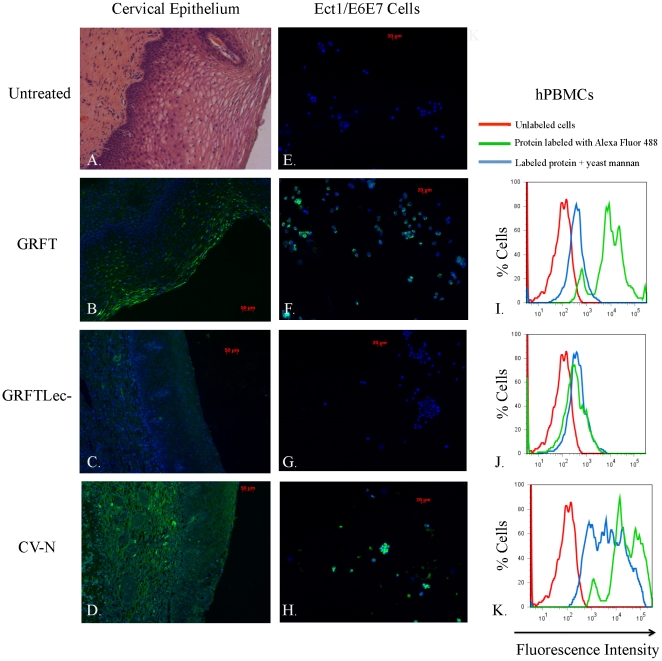
Figure 1. Analysis of binding specificity of GRFT in comparison with GRFTlec- and CV-N.
In the first column we depict fluorescence micrographs that show binding of AlexaFluor 488-labeled GRFT (B.), GRFTLec- (C.) and CV-N (D.) to paraffin-embedded cervical tissue sections from a 21-year old female. In (A.) we show a hematoxilin and eosin-stained light micrograph of cervical epithelial tissue, showing the general micro-anatomy of the cervical epithelium. In the second column, we show fluorescent micrographs of cultured human ectocervical cell line Ec1/E6E7 untreated (E.), and treated with AlexaFluor 488-labeled GRFT (F.), GRFTLec- (G.) and CV-N (H.). The third column shows histograms that depict flow cytometric analysis of hPMBCs treated with fluorescently labeled GRFT (I.), GRFTLec- (J.) and CV-N (K.). The X-axis shows increasing fluorescence intensity from left to right, the Y-axis shows percentage of labeled cells in the sample.

