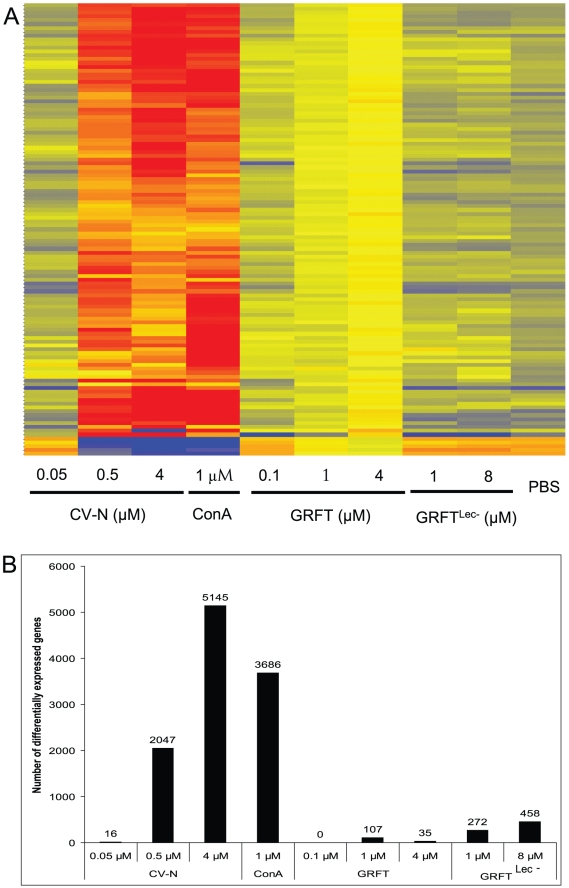
Figure 9. Effect of lectin treatment on gene expression profiles.
Cells were treated with CV-N (0.05, 0.5 and 1 µM), ConA (1 µM), GRFT (0.1, 1 and 4 µM), GRFTLec- (1 and 8 µM) or PBS before RNA isolation, and hybridization with Agilent total human genome microarrays. The heat map (A.) was derived from normalized data using GeneSpring GX 10 software. B. A graphical representation of the total number of genes detected as differentially expressed using Benjamini-Hochberg low stringency correction with a cutoff of 2.0, are reported for CV-N (0.05, 0.5 and 1 µM), ConA (1 µM), GRFT (0.1, 1 and 4 µM), GRFTLec- (1 and 8 µM) and PBS samples.

