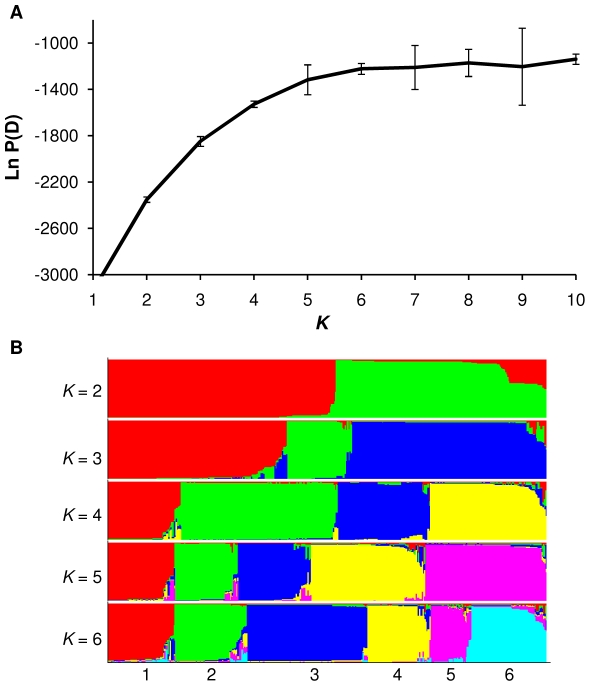
Figure 3. Population structure of the gene encoding DBPII based on Bayesian cluster analysis using Structure 2.3 software.
(A) Plot of the log probability of the data [Ln P(D)] and its standard deviation (vertical bars) given values for K of 1–10. (B) Population clustering for K = 2–6. Each individual is represented by a thin vertical color. Each color represents an ancestral population (pop), and the color of individual represents their proportional membership in the different populations. Ancestral populations: red, pop1; green, pop2; blue, pop3; yellow, pop4; pink, pop5 and light blue, pop6. The figure shown for a given K is based on the highest probability run at that K.

