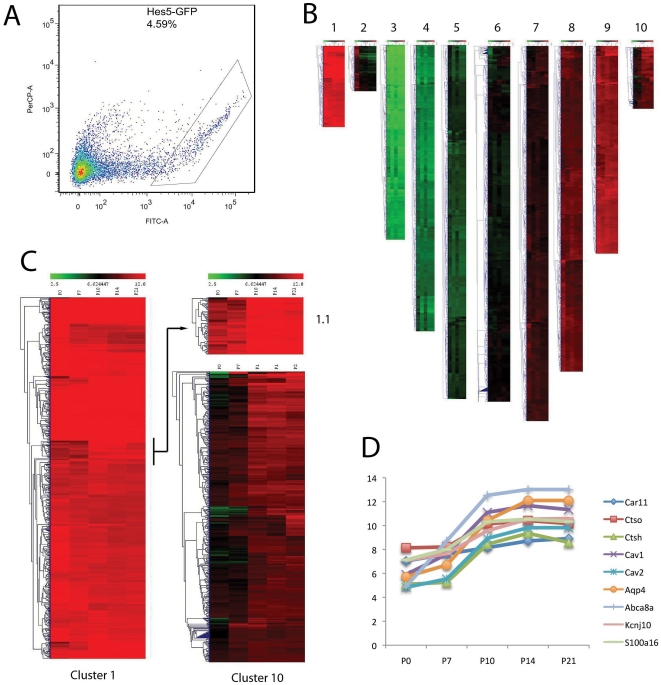
Figure 4. FACS purified Muller glia subjected to Affymetrix analysis.
(A) Hes5-GFP expressing cells were separable from non-expressing cells, with the box outlining the gate for selection of the positive cells. (B) The gene expression levels (log transformed) across the five ages of retinal development are shown as heat maps. (C,) Clusters 1 (with 3% of the total genes) and 10 (with 3% of the total) contained previously characterized Müller glial genes. (D) Graph of the expression levels of 9 genes previously reported to be enriched in mature Müller glia,; all of these genes show a clear increase between P7 and P10 as the Müller glia mature.

