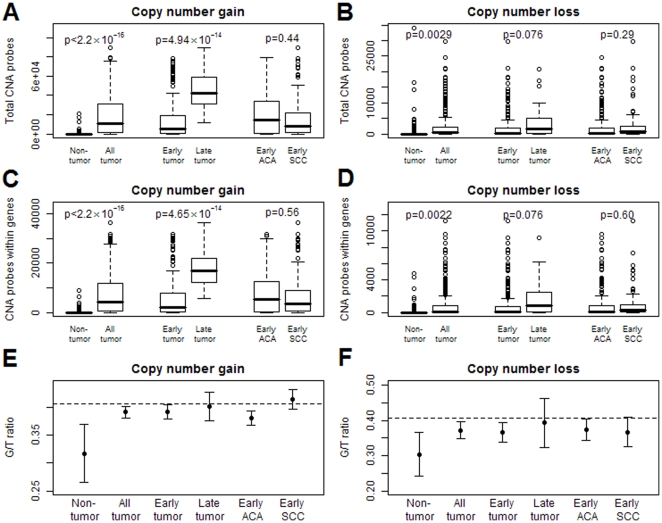
Figure 2. Total probes (TP) and probes locating within genes (GP) in which CNAs were detected, and the mean of G/T ratios.
A, B, Counts of the total probes (TP) where CNAs events (A: copy number gains, B: copy number losses) occur were plotted for blood and non-involved tissue, total tumor, early stage tumor, late stage tumor, early stage adenocarcinoma (ACA) and early stage squamous cell carcinoma (SCC). C, D, Counts of the probes within genes (GP) in which CNAs events (C: copy number gains, D: copy number losses) were detected in the same six subgroups. E, F, Mean and its 95% confidence interval of G/T ratios in the six subgroups for copy number gains (E) and losses (F); and the dashed lines represent the null G/T ratio on the chip (104,256/256,554 = 40.64%). Non-tumor: blood (n = 63) and non-involved tissue (n = 50); All tumor: total 301 NSCLC tumors; Early tumor: stage I and II NSCLC tumors (n = 246); Late tumor: stage III and IV NSCLC tumors (n = 25); Early ACA: early stage adenocarcinoma tumors (n = 208); Early SCC: early stage squamous cell carcinoma tumors (n = 93).

