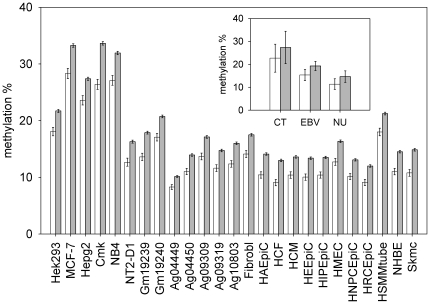
Figure 1. Methylation of HIR CGIs compared to methylation of CGIs in other genomic regions.
For each cell line, the mean methylation value of CGIs inside HIR regions (open bars) and of the CGIs in the remaining part of the genome (closed bars) are reported. Inset shows the same data summarized by cell group (Cancer Transformed = CT, EBV transformed = EBV, Normal Untransformed = NU). Values are means +/− Standard Error (SE).

