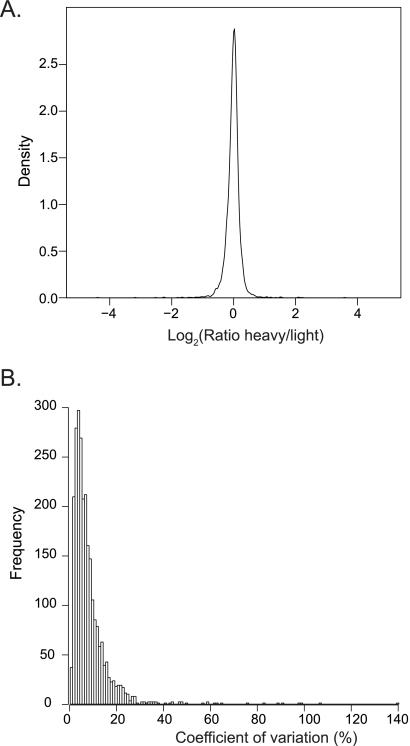
Fig. 5.
SILAC-based quantification of HEK293 proteins. HEK293 cells were labeled with heavy or light amino acids and quantified using single-run analysis. A, A density plot shows the ratio distribution of proteins from a triplicate single-run analysis. B, Histogram of the coefficient of variation of each of the quantified proteins.

