Fig. 4.
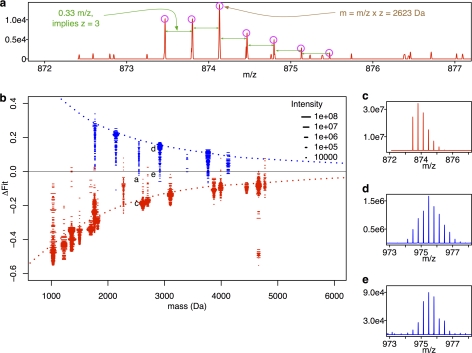
Observed isotope distributions of PhHg modified and unmodified rabbit GAPDH peptides are distinct. The procedure used to generate ΔFit for observed isotope distributions is identical to that for Fig. 2 except that analysis begins by replacing Fig. 2 boxes 1–3 with observed isotope distributions and observed mass (panels A and C–E). All isotope distributions were collected as described under “Experimental Procedures” from MS1 scans in LC-MS/MS runs of tryptic digests of pure PMA-exposed rabbit GAPDH. Panel (B) plots ΔFit scores for observed isotope distributions of unmodified (red dashes “-”) and modified peptides (blue dashes “-”) as a function of observed mass. The dotted lines are loess smoothed curves of the values computed on the noise-free isotope distributions shown in Fig. 2(D). Each dash (-) represents the fit score for an individual isotope distribution from a single MS1 scan, and the length of the dash indicates the intensity of the tallest peak in that isotope distribution. Labels “a”, “c”, “d” and “e” identify points corresponding to the example distributions in those panels (A, C, D, and E). The distribution displayed in panel (C) is for the same peptide as in (A) but with a stronger signal. Panels (D) and (E) are examples of relatively strong (D) and weak (E) intensity distributions for another PhHg modified peptide.

