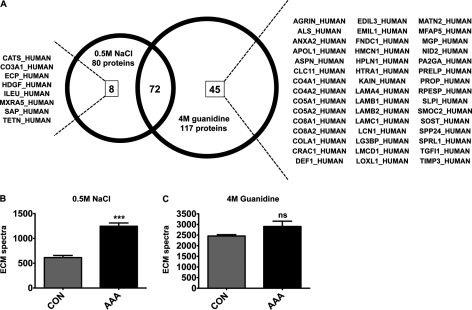
Fig. 3.
Differential solubility of extracellular proteins. A, The Venn diagram displays the number of ECM and associated proteins extracted with either 0.5 m NaCl or 4 m guanidine. The SwissProt entry codes of uniquely identified proteins are given for each extract. All identifications are listed in Tables I and II. B, In the 0.5 m NaCl extracts the spectral counts for ECM proteins were significantly increased in the AAA samples in comparison to control aortas (CON). The total number of identified spectra was similar. C, In the 4 m guanidine extracts neither the spectral counts for ECM proteins nor the total number of spectra were significantly different between controls and AAA. Values are mean ± S.E. *** p ≤ 0.001. Statistical analysis was performed using 2-tailed, unpaired t test.

