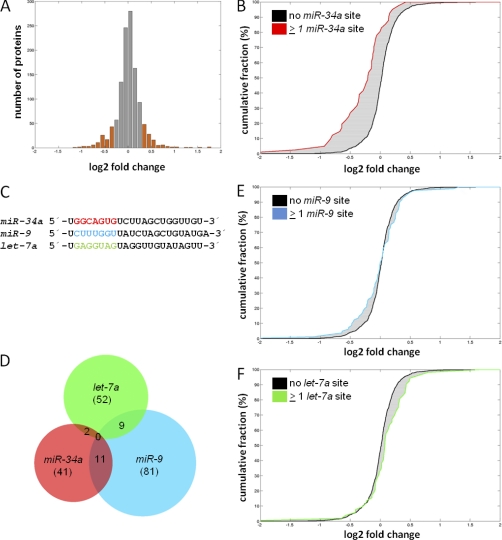
Fig. 2.
miR-34a expression results in specific changes in protein expression. A, Histogram of changes in protein expression after ectopic miR-34a expression for all 1206 proteins quantified in at least two out of three biological replicates. Translationally regulated genes with a log2 fold change ≤ –0.3/≥ 0.3 are highlighted as orange bars. Fold change denotes the ratio of peptide intensities of doxycycline-treated, heavy-labeled versus untreated, medium-heavy labeled cells. B, Cumulative distribution of miR-34a targets with ≥1 seed-matching sequence in the 3′-UTR (red line) among proteins detected by pSILAC without the respective seed-matching sequence in the 3′-UTR of their mRNAs (black line). C, Sequences of the mature miR-34a, miR-9 and let-7a microRNAs. The seed sequences are high-lighted in red, blue and green, respectively. D, Venn diagram of bioinformatically predicted targets of miR-34a, miR-9 and let-7a with ≥1 seed-matching sequence in the 3′-UTR of the mRNAs corresponding to proteins identified by pSILAC. The total number of detected targets for each miRNA is given in brackets. E, F, Cumulative distributions of miR-9 and let-7a targets with ≥ 1 seed-matching sequence in the 3′-UTR (blue or green lines) among proteins detected by pSILAC without the respective seed-matching sequence in the 3′-UTR of their mRNAs (black lines).

