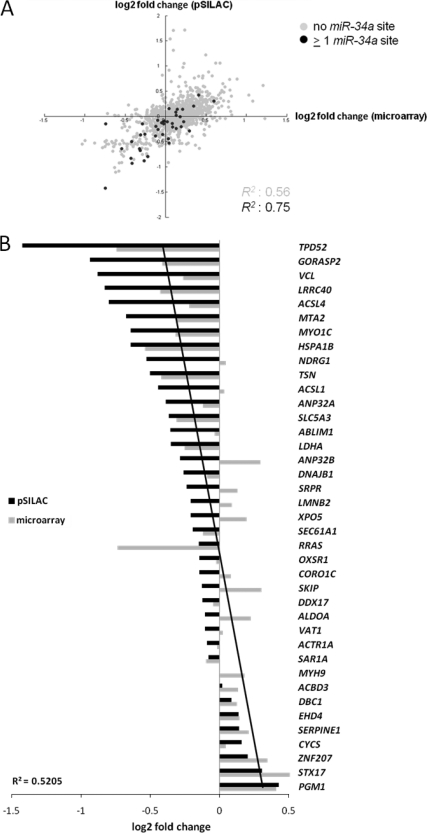
Fig. 4.
miR-34a-mediated changes in protein synthesis correlate with changes in mRNA abundance. A, Scatter plot correlating changes in protein synthesis as measured by pSILAC with changes in mRNA abundance as measured by microarray analysis. The Pearson′s correlation coefficient R2 is shown for genes with predicted miR-34a seed-matching sequences compared with genes without miR-34a seed matches. B, Representation of 39 miR-34a targets detected both by pSILAC and microarray analysis containing miR-34a seed-matching sequences. The miR-34a targets are sorted on the basis of log2 fold changes in protein synthesis as measured by pSILAC and are represented as horizontal bars. In addition, the corresponding log2 fold changes in mRNA abundance for each miR-34a target as determined by microarray analysis are shown. The linear regression for changes in mRNA abundance is depicted as a black line. The regression coefficient R2 is indicated.

