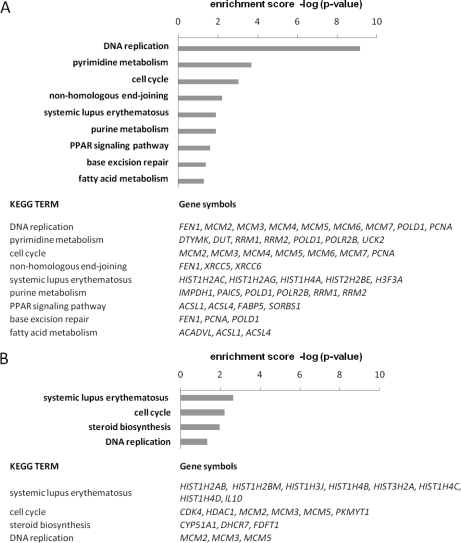
Fig. 6.
KEGG pathway associations of down-regulated proteins and mRNAs. The enrichment scores of biological processes are shown as –log(p-value). For each KEGG pathway, the gene symbols of differentially down-regulated genes are shown in the table given below. Translationally down-regulated candidate proteins (A) and mRNAs (B) down-regulated with log2 fold change ≤–0.3, p < 0.05, were subjected to KEGG pathway enrichment analysis (http://david.abcc.ncifcrf.gov/) irrespective of the presence of miR-34a binding sites.

