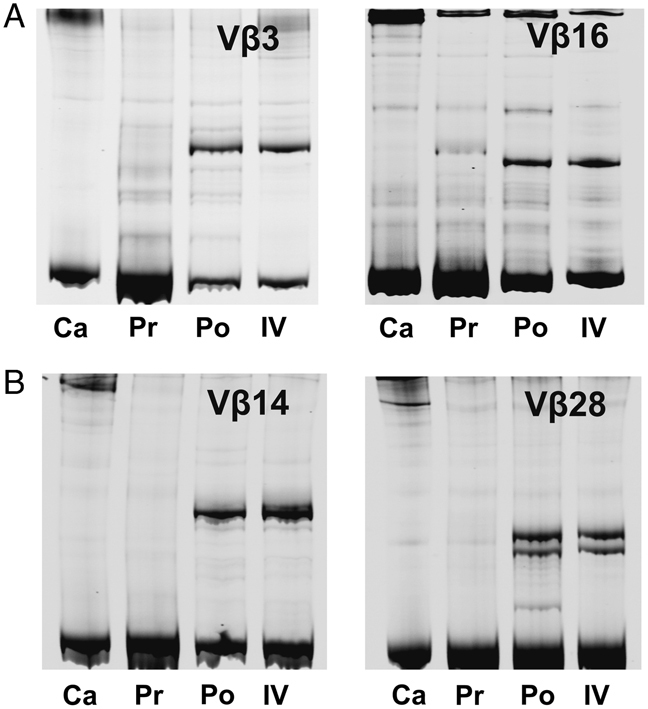
Figure 5.

TCR CDR3β heteroduplex analysis of bovine CD8+ T-cell responses to T. parva: Results are shown for CD8+ T cells from animal 641 (A) analysed for subgroups Vβ3 and Vβ16, and for CD8+ T cells from animal 011 (B) analysed for subgroups Vβ14 and Vβ28. Lanes labelled Pr represent resting CD8+ memory T cells harvested ex vivo prior to parasite challenge, those labelled Po represent CD8+ T cells harvested ex vivo 10 days following challenge and those labelled IV represent a CD8+ T-cell line derived immediately prior to challenge. Lanes labelled Ca show the respective heteroduplex carriers loaded with dH20 as a control for bands not related to T-cell populations. Homoduplexes formed by re-annealing of the carrier DNA strands are represented by a prominent band towards the bottom of each lane. Additional more slowly migrating bands in the upper part of the gel represent heteroduplexes formed from cDNA of expanded clonotypes expressing Vβ genes of the respective subgroup.
