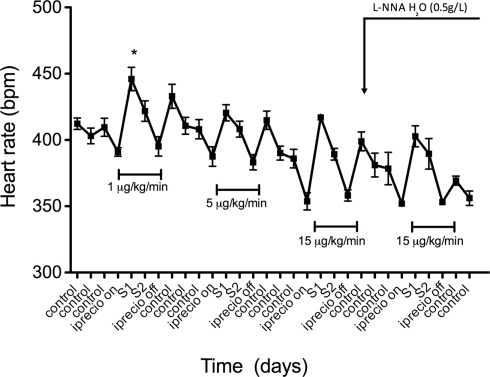
Figure 7.
Effects of increasing doses of 5-HT on mean heart rate (HR) in male Sprague Dawley. Points represent mean ± SEM for five (5) animals. Time is represented by days on the x-axis. S represents days of 5-HT infusion. *Statistically significant (p < 0.05) difference from control heart rate. Horizontal bracketed bars indicate the time window over which 5-HT infusion was on.

