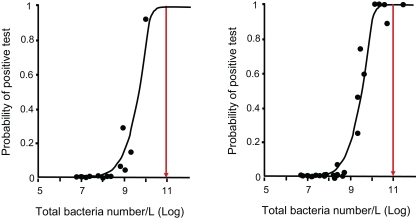
Figure 1.
Relationship between cell density (direct count of bacterial cell number with epifluorescence) and results of para-nitrophenol biodegradability test (shown by the points) and probability model (solid line) for tests conducting with river waters inocula (A) or activated sludge inoculums (B) (according to Thouand et al., 1996). Each point is the probability of para-nitrophenol tests (or the percentage of tests) obtained for a specific cell density. The red arrows represent the cell density (1011 bacteria/L) leading to 99.9% of positive tests. (i.e., biodegradation of para-nitrophenol). At this cell level, the origin of the inoculum did not influence the issue of the test.

