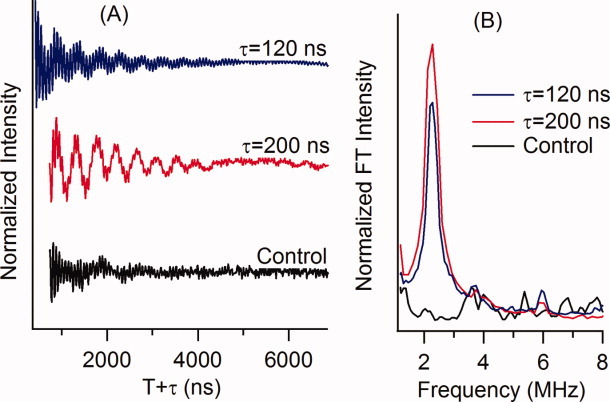
Figure 1.

(A) Three-pulse ESEEM time-domain spectra of M2δ in a lipid bicelle. The top is i + 3 2H-labeled Val 15 at τ = 120 ns (blue), the middle is i + 3 2H-labeled Val 15 at τ = 200 ns (red), and the bottom is the nondeuterated control sample at τ = 200 ns (Black). (B) Frequency domain where red illustrates the i + 3 sample, blue illustrates the i + 3 sample, and black the control.
