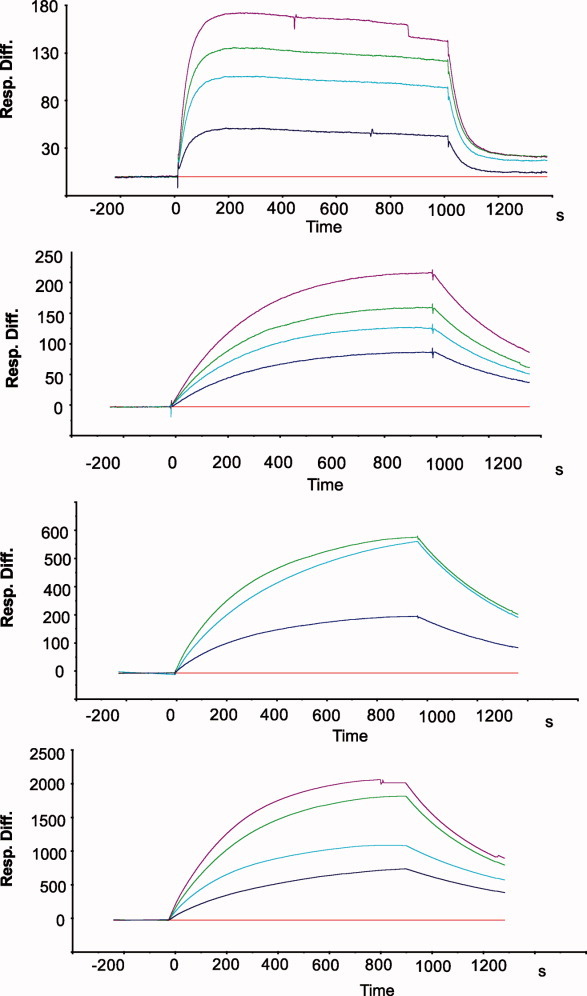
Figure 3.

SPR sensograms showing the interaction of immobilized biotin and monomeric streptavidin variants. The traces represent experimental data in response units at 0 nM (red), 25 nM (blue), 50 nM (cyan), 100 nM (green), and 125 nM (magenta) of streptavidin variants.
