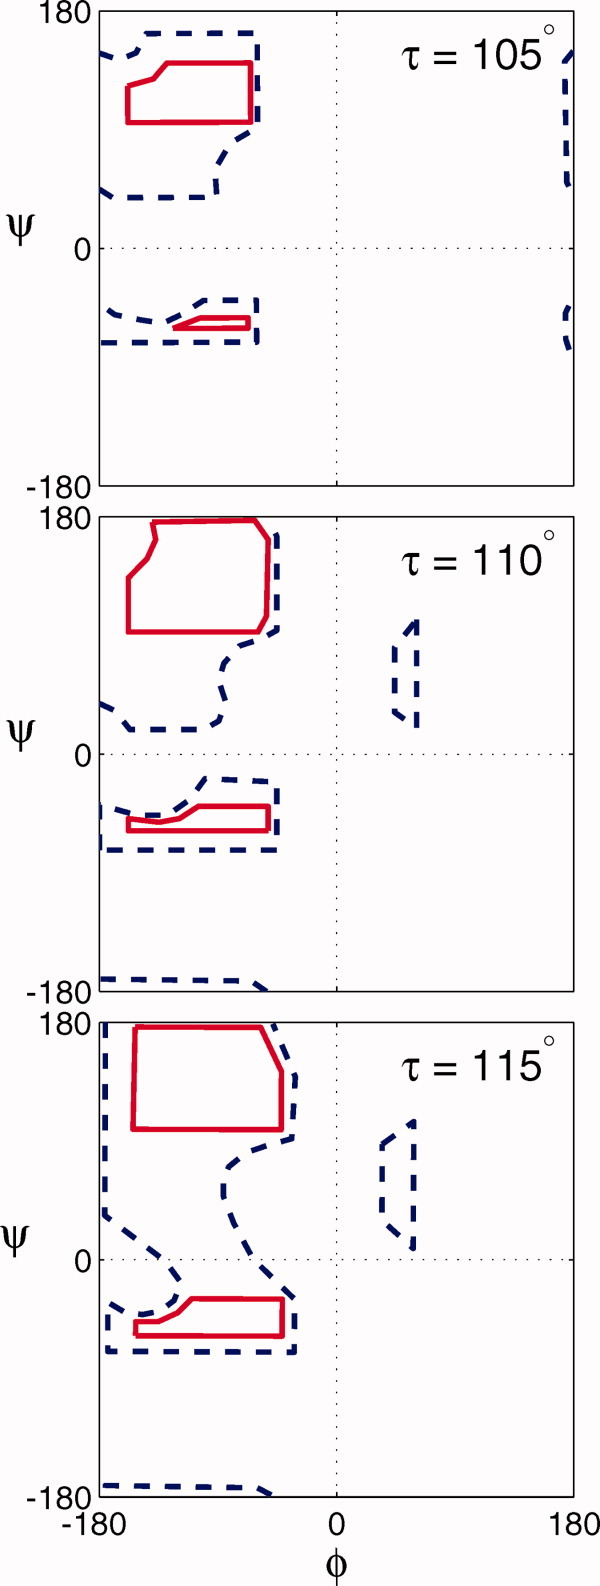
Figure 2.

Calculated Ramachandran Plots. Ramachandran plots of allowed φ/ψ combinations for three values of τ.2 The solid red lines enclose the “normally allowed” φ/ψ combinations and the dashed blue line indicates the “outer limit”. [Color figure can be viewed in the online issue, which is available at wileyonlinelibrary.com.]
