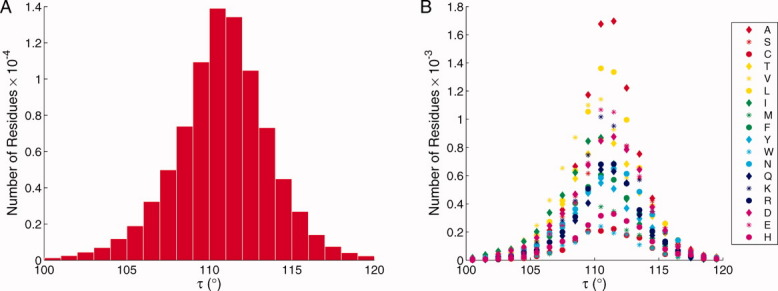
Figure 3.

Distribution of the bond angle τ. A: Distribution of τ for all 86,299 residues in the Dunbrack data base (excluding Gly and Pro). Number of residues plotted against the indicated τ ranges. B: Distribution of τ for each type of residue in the Dunbrack data base (excluding Gly and Pro). The residue types are identified using the single letter code. [Color figure can be viewed in the online issue, which is available at wileyonlinelibrary.com.]
