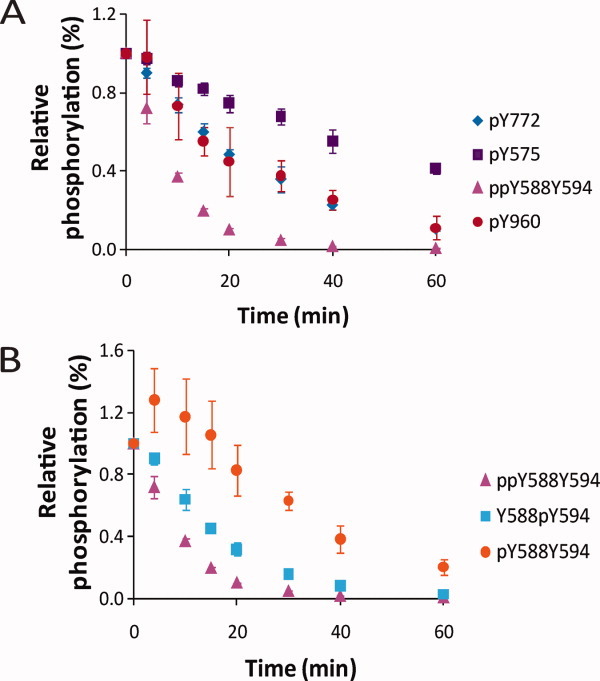
Figure 3.

Dephosphorylation of EphA2 C0 by HCPTP-B. Samples drawn at various timepoints were subjected to SRM-MS analysis. The percentage phosphorylation for the sample at 0 min was adjusted to 100%, and the percent phosphorylation over time is plotted relative to 0 min. (A) A comparison of the dephosphorylation profiles for pY772, ppY588Y594, pY575, and pY960. (B) A comparison of the dephosphorylation profiles for the three phosphorylated forms of the peptide containing both pY588 and pY594. All experiments were repeated at least three times and the mean and SD from the mean are shown.
