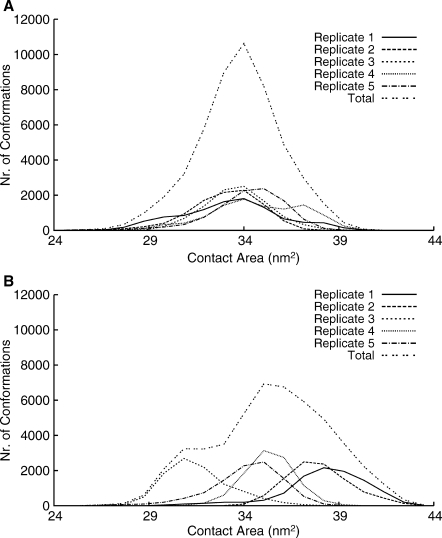
Figure 2.

Histograms of the contact surface between the NBD monomers. The contact surface was calculated as the difference between the sum of the solvent accessible surfaces of the two isolated NBD monomers and the solvent accessible surface of the NBD dimer. A: ATP state. B: ADP-IP state.
