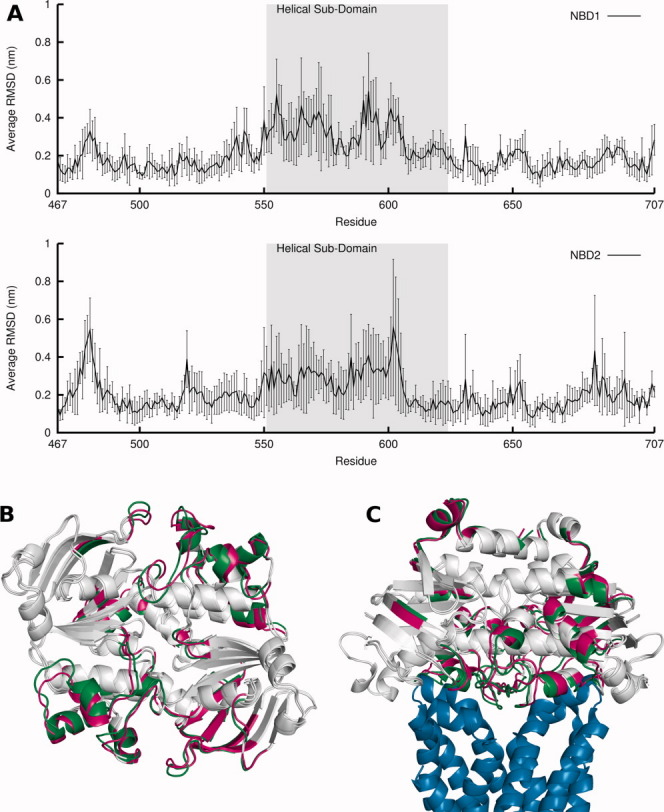
Figure 3.

Comparison between ATP and ADP-IP states: RMSD, average structures and relation to the TMDs. A: Average RMSD per residue over all replicates of ADP-IP state in relation to ATP state. The RMSD calculation was done for each ADP-IP state replicate average structure in relation to the average structure of the ATP state replicate from which the ADP-IP state simulation started from, and was averaged over all five simulations, with the standard deviations of the means represented in vertical lines. The helical sub-domain is highlighted in gray. B: Aligned global average structure over all simulations for ATP and ADP-IP states. The average structures are in cartoon representation and in a bottom view. The ATP and ADP-IP state average structure is colored in green and magenta, respectively, with zones that have less than 0.1 nm difference in RMSD between states colored in gray. C: Same as (B), but now aligned with Sav1866 TMDs (in blue) and in a side view. [Color figure can be viewed in the online issue, which is available at http://wileyonlinelibrary.com.]
