
Figure 4.
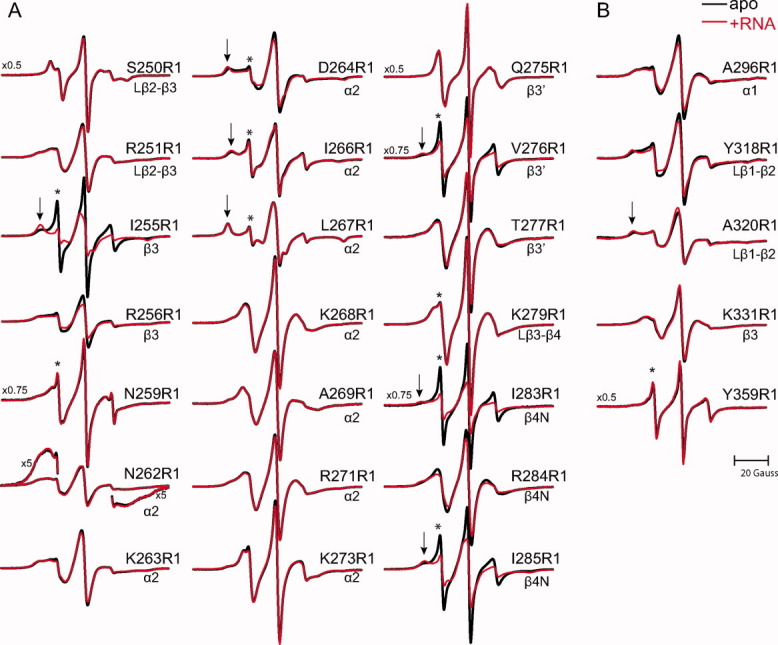
EPR spectra of apo and RNA bound mouse ORF1p. EPR spectra of ORF1p R1 mutants at sites in the RRM (panel A) or CTD (panel B) in the absence (black) and a presence of a 60-mer L1 RNA (red). Spectral features indicating highly dynamic components are designated by an asterisk; those indicating relatively immobilized states are designated by an arrow. The magnetic field scan width is 100 G. All spectra are normalized to the same concentration of nitroxide. Vertical scaling factors (left side of spectrum) were applied to select spectra for display purposes.