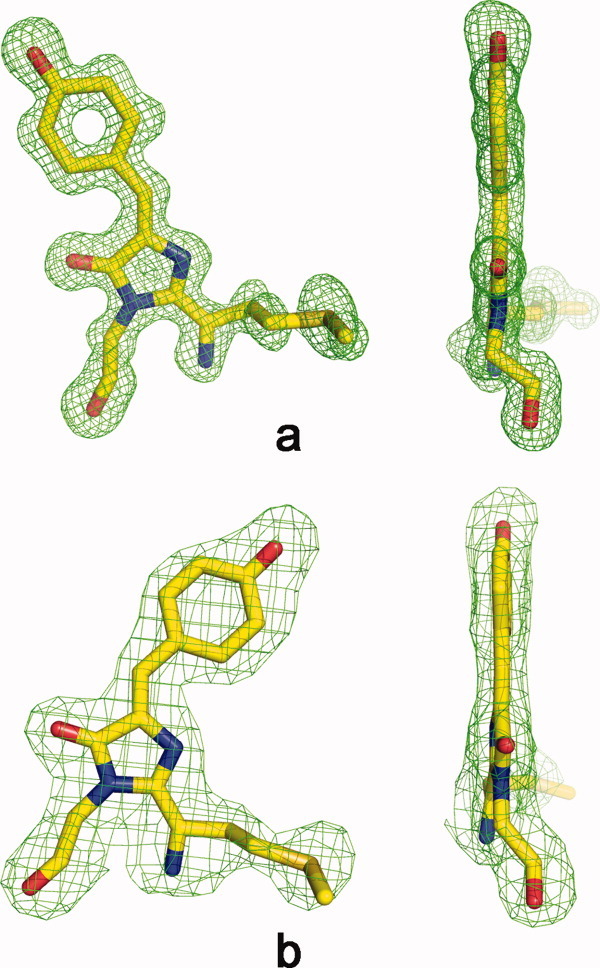
Figure 2.

Front and side views of chromophores in fluorescent state in a Fo-Fc omit electron density (cutoff ρ = 3.0 σ). Trans conformation in eqFP578 at pH 5.5 (a) and cis conformation in Katushka at pH 8.5 (d). This figure was produced with PYMOL.19
