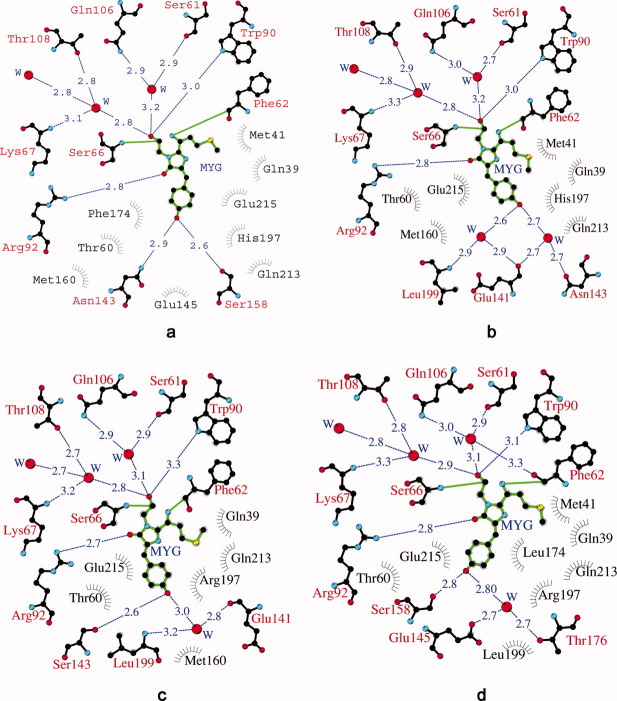
Figure 4.
A diagram illustrating the environment of chromophore in crystal structure. eqFP578: trans fluorescent state at pH 5.5 (a) and cis nonfluorescent state at pH 4.0 (b); Katushka: cis fluorescent state at pH 8.5 (c), and trans nonfluorescent state at pH 5.0 (d). Hydrogen bonds (≤ 3.3 Å) are shown as blue dashed lines, waters (W) as red spheres and van der Waals contacts (≤ 3.9 Å) as black “eyelashes.” This Figure was produced with LIGPLOT/HBPLUS.25,26

