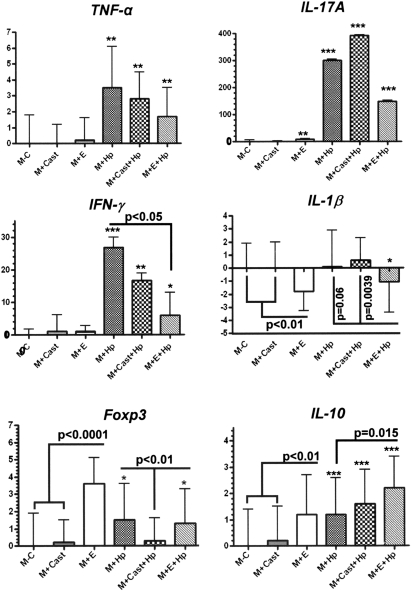
Fig. 3.
Gastric tissues (n = 5–8 per group) were evaluated by quantitative polymerase chain reaction for mRNA levels of selected inflammatory mediators normalized to expression of GAPDH. The y-axis represents mean fold change of mRNA levels in reference to control mice (uninfected, E2 untreated intact male INS-GAS mice denoted as (M − C). M + Cast indicates castrated males; M + E indicates E2-treated males; M + Hp indicates H.pylori-infected males. Error bars represent standard deviations. *P < 0.05, **P < 0.01, ***P < 0.001 indicate significant differences compared with control values. Additional significant differences between experimental groups are indicated by P values.

