Figure 2.
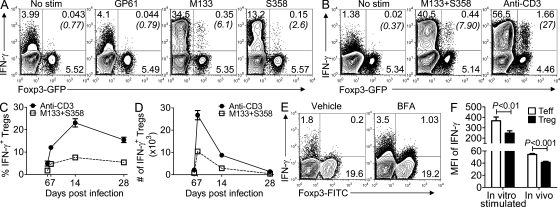
Expression of IFN-γ by rJ2.2-specific T reg cells. (A–D) rJ2.2-infected Foxp3gfp mice were sacrificed at the indicated times after infection and CNS-derived lymphocytes analyzed for IFN-γ production after peptide stimulation. Representative experiments for 14 d after infection are shown in A and B. (A) M133- and S358-specific T reg cells express IFN-γ. Stimulation with lymphocytic choriomeningitis virus GP61 or no peptide served as controls. (B) T reg cells express IFN-γ after stimulation with M133 + S358 peptides or anti-CD3 mAb. Numbers in parentheses represent percentage of IFN-γ+ T reg cells. (C and D) Mean frequency (C) and number (D) of T reg cells that express IFN-γ after stimulation with peptides M133 + S358 or anti-CD3 mAb. Data shown are representative of 3–20 single or pooled brain samples per time point in 3–10 independent experiments. (E) rJ2.2-infected B6 mice were treated with BFA or vehicle at 6 d after infection. After 6 h, CNS-derived lymphocytes were analyzed for IFN-γ expression. Plots shown were gated on CD4 T cells. Data are representative of six mice in two independent experiments. 5.1 ± 0.5 and 4.6 ± 0.3% of Foxp3− and Foxp3+ cells, respectively, expressed IFN-γ after in vivo BFA treatment. (F) IFN-γ is expressed at higher levels in effector CD4 T cells than in T reg cells after peptide M133 + S358 stimulation (data from 10 single or pooled brain samples analyzed at 7, 14, or 28 d after infection are combined) or after in vivo BFA treatment (six mice in two independent experiments). MFI, mean fluorescence intensity. Error bars in C, D, and F indicate mean ± SEM.

