
Figure 4.
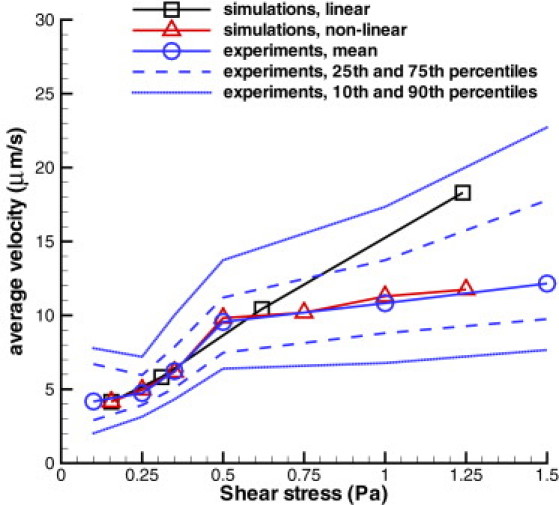
Average rolling velocity of infected RBCs depending on the WSS in comparison with the experiments of cell rolling on purified ICAM-1 (13). Experimental data include mean values and curves that correspond to the 10th, 25th, 75th, and 90th percentiles.