
Figure 4.
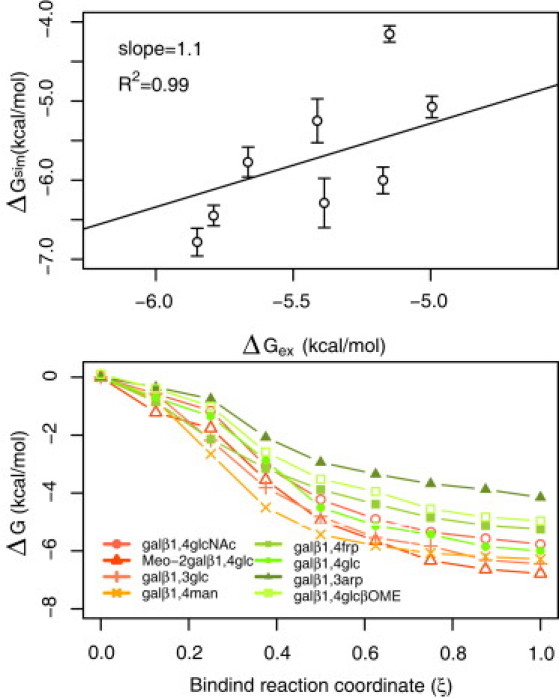
Free energy of binding from unbinding simulations. (Top) Correlation between experimental ΔGexp and simulations estimated ΔGsim for all disaccharides. The slope and R2 of the linear fit are presented in the plot. (Bottom) Binding free energy profile per step. In the x axis, 0 represents the unbound conformation, and 1 the unbound conformation. Different curves correspond to different disaccharides.