Fig 5.
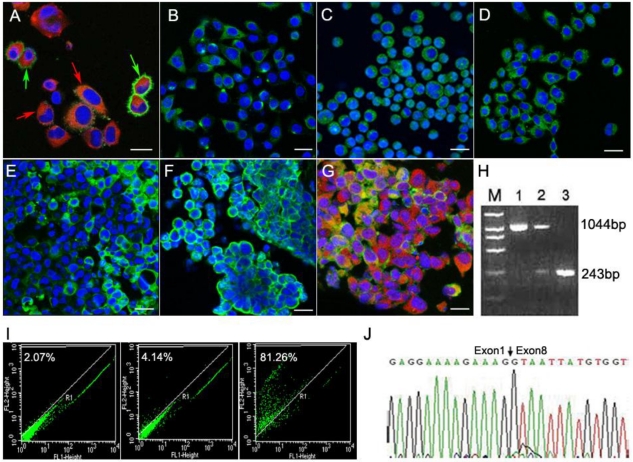
Immunofluorescence assays showed that the T1 cells expressed neural stem cell markers nestin (red & red arrowheads) and CD133 (green & green arrowheads A). Scale bar, 20 μm. CXCR4 (B), EGFR (C) and EGFRvIII (D) were expressed in the T1 cells. Scale bar, 50 μm). Immunoflurescence analyses of tumor tissue sections (Scale bar: 20 μm) derived from T1 cell intracranial transplantation are shown (E-G). EGFR (green) and GFAP (red) were both expressed by transplanted T1 cells (G). Nuclei were detected using the DAPI staining method (blue). The RT-PCR results showed that the products of EGFR and EGFRvIII were 1044-bp and 243-bp (H), respectively. Lane 1 was for the neurospheres samples, showing EGFR 1044bp band; Lane 2 was for the CD133(-) T1 cells, showing two bands including EGFR (1044bp) and EGFRvIII (243bp); Lane 3 was for the CD133(+) T1 cells, and showed the 243-bp EGFRvIII band only. The CD133(+) and CD133(-) cells from intracranial T1 cell-induced tumor were separated using the CD133-specific antibody (I). Sequencing result confirmed the expression of the EGFRvIII gene (J).

