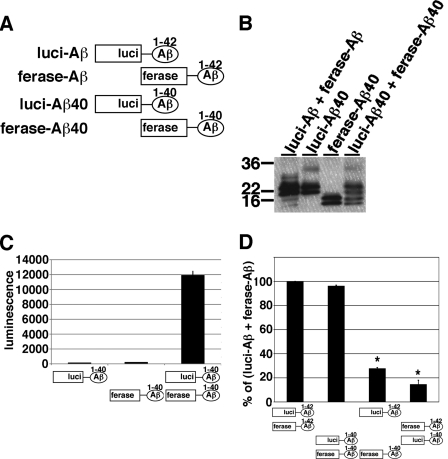
FIGURE 4.
Oligomer formation of split Gluc-tagged Aβ1–40. A, scheme for split Gluc-tagged Aβ1–42 and Aβ1–40. We generated luci-Aβ1–40 and ferase-Aβ1–40 stably expressing HEK293 cells. B, immunoblotting of the CM from luci-Aβ1–40, ferase-Aβ1–40, and double (luci-Aβ1–40/ferase-Aβ1–40) and double (luci-Aβ/ferase-Aβ) stably expressing HEK293 cells by anti-Aβ mAb 6E10. C, luciferase assay of the CM from luci-Aβ1–40, ferase-Aβ1–40, and double (luci-Aβ1–40/ferase-Aβ1–40) stably expressing HEK293 cells. The luminescence ± S.D. in three independent experiments are shown. D, comparison of luciferase activity of the CM from double (luci-Aβ/ferase-Aβ, luci-Aβ1–40/ferase-Aβ1–40, luci-Aβ/ferase-Aβ1–40 and luci-Aβ1–40/ferase-Aβ) stably expressing HEK293 cells. The luminescence was standardized by the expression levels of split Gluc-tagged Aβ and shown as the ratio relative to the level of luminescence of the CM from double (luci-Aβ/ferase-Aβ) stably expressing HEK293 cells as 100%. The luminescence ± S.D. in three independent experiments are shown. ANOVA test p < 0.01 (*).

