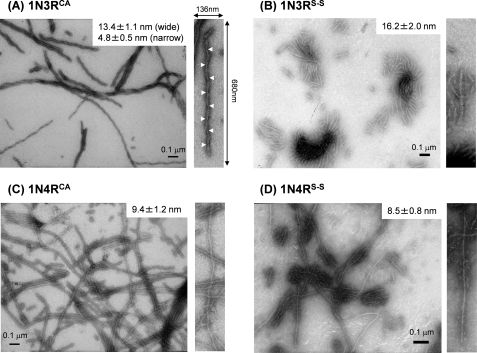
FIGURE 2.
Morphologies of Tau fibrils observed by transmission electron microscopy. A, 1N3RCA fibrils. B, 1N3RS-S fibrils. C, 1N4RCA fibrils. D, 1N4RS-S fibrils. An average value of fibril widths is indicated, and a magnified image (136 × 680 nm) of a representative Tau fibril is also shown on the right side of each panel. White arrowheads indicate cross-over points of Tau fibrils with helical morphologies.

