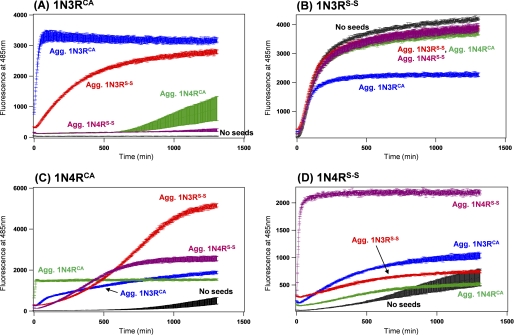
FIGURE 4.
A seeding reaction of Tau fibrils monitored by ThT fluorescence intensity. 10 μm Tau of 1N3RCA (A), 1N3RS-S (B), 1N4RCA (C), and 1N4RS-S (D) was prepared in a 50 mm Tris buffer, pH 7.2, containing 1 mm EDTA, 2.5 μm heparin, and 16.7 μm ThT, and fluorescence increase was monitored in the absence of sample agitation. A black trace shown in each panel represents the kinetics in the absence of any added seeds. Seeding reactions were examined by the addition of aggregates of 1N3RCA (blue), 1N3RS-S (red), 1N4RCA (green), and 1N4RS-S (purple) in soluble Tau proteins (A–D). Amounts of added aggregates were 0.5 μm (monomer-base), which corresponds to 5% of the amounts of soluble Tau. The kinetic traces were quantitatively analyzed by a sigmoidal fit (see “Experimental Procedures”), and the fit parameters are summarized in Table 2. Three independent experiments were performed to estimate errors.

