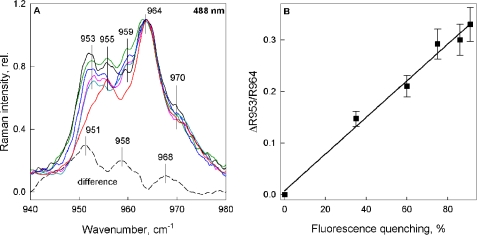
FIGURE 4.
ν4 region of the resonance Raman spectra for Neo excitation (488.0 nm). A, LHCII gels in the unquenched state (red) and with increasing levels of quenching (cyan, 35%; magenta, 60%; blue, 75%; green, 86%; black, 91%). Spectra were normalized at 964 cm−1. The dotted line displays the difference spectrum quenched − unquenched for maximum quenching (91%), after normalization in the ν3 region. Vertical lines indicate the vibrational modes discussed under “Results.” B, relationship between the change in 953 cm−1 Raman intensity (relative to 964 cm−1 intensity) from A and the extent of fluorescence quenching, expressed as a percentage of fluorescence in the unquenched LHCII gel. The error bars in B are the calculated amplitude of noise on the spectrum obtained using Datamax GRAMS32 Galactic software (Instruments SA).

