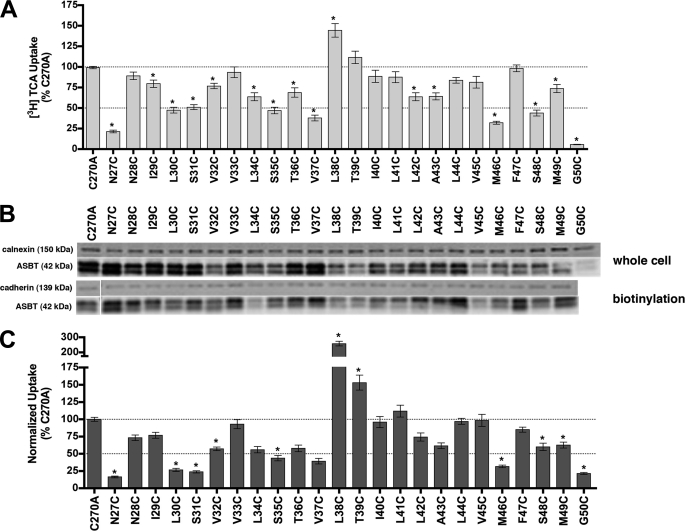
FIGURE 2.
[3H]TCA uptake and protein expression of TM1 cysteine mutants. A, COS-1 cells were transfected with C270A or mutant plasmids as described under “Experimental Procedures.” Rates of uptake were expressed as a percentage of the parental transporter, C270A, in pmol [3H]TCA internalized per minute per milligram of protein. Bars represent the S.E. of three independent experiments, each performed in triplicate. ANOVA with p < 0.05 (*) indicates significant mean differences. B, total (whole cell) and cell surface (biotinylation) protein expression of Cys mutants. Equal amounts of protein (7 μg/lane) were loaded on a 12.5% denaturing polyacrylamide gel, and hASBT protein was identified using a custom anti-hASBT antibody (1:1,000). Labeling selectivity to cell surface proteins was confirmed by the absence of a 90 kDa band for the ER protein calnexin (mouse anti-calnexin; 1:1,000), and presence of a 140 kDa band for the cell surface marker pan-cadherin (mouse anti-cadherin; 1:1,000). Mature glycosylated hASBT visualizes as the 41 kDa band while the lower, 38 kDa band (not indicated) represents the unglycosylated species. Blots are representative of two independent experiments. C, rate of uptake expressed as a percentage of the parental transporter, C270A, normalized to ASBT cell surface expression (from B, lower panel). Because levels of glycosylated (41 kDa) and unglycosylated (38 kDa) protein were tightly correlated, only glycosylated protein bands were considered for densitometric analysis.

