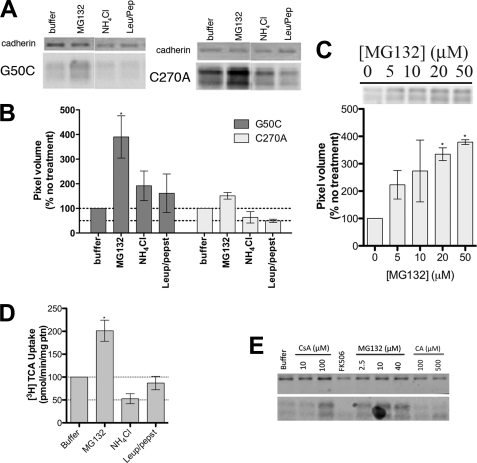
FIGURE 7.
Mechanism of G50C instability. COS-1 cells transiently transfected with C270A or G50C were treated with appropriate reagents for specified amounts of time. For the protein expression experiments, equal amounts of protein were loaded on a 12.5% Tris. HCl polyacrylamide gel (7 μg/lane for C270A and 8.5 μg/lane for G50C). Protein bands were visualized with the primary antibodies rabbit anti-hASBT (1:1,000) and mouse anti-cadherin (1:1,000), and the secondary antibodies anti-mouse IRDye 680 (1:10,000) and anti-rabbit DyLight 800 (1:10,000). Blots are representative of two independent experiments. A, effect of degradation inhibitors on G50C expression. Cells were treated with 20 μm MG132, 15 mm NH4Cl, and leupepsin/pepstatin (100 μg/ml of each). After 8 h, which corresponds to the ASBT protein degradation half-life as determined after cyclohexamine treatment (data not shown), cells were harvested and submitted to Western blotting. B, densitometric analysis of the Western blot bands, normalized to loading amounts and the loading control cadherin. Bars represent the S.E. of two independent experiments, relative to untreated control. C, dose-dependent inhibition of G50C proteasomal degradation with MG132 and densitometric analysis of Western blot bands. Cells were treated with various MG132 concentrations (5–50 μm) for 8 h, after which cells were harvested and submitted to Western blot. Denstitometric analysis included normalization to loading amounts and the loading control cadherin. Bars represent the S.E. of two independent experiments, relative to untreated control. D, [3H]TCA uptake of G50C treated with degradation inhibitors. Transfected COS-1 cells were treated with the appropriate reagents (20 μm MG132, 15 mm NH4Cl, and leupepsin/pepstatin 100 μg/ml of each) for 8 h, followed by TCA uptake as described under “Experimental Procedures.” Rates of uptake were expressed as a percentage of untreated control (buffer), normalized for negative control (mock), in pmol of [3H]TCA internalized per minute per milligram of protein. Bars represent the S.E. of two independent experiments, each performed in triplicate. E, G50C cell surface expression after treatment with degradation inhibitors/chaperones. Cells were treated with CsA (10 and 100 μm), FK506 (100 μm), and CA (100 and 500 μm) for 24 h and MG132 (2.5, 10, and 40 μm) for 8 h followed by biotinylation of cell surface proteins as described under “Experimental Procedures.”

