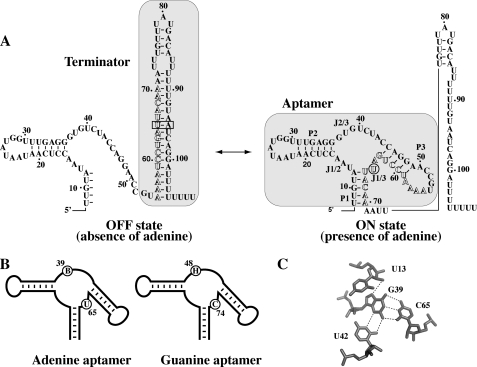
FIGURE 1.
A, schematic representing the ligand-induced pbuE adenine riboswitch transcription activation. Shaded regions represent the transcription terminator and the aptamer structure. Outlined letters represent nucleotides involved in the formation of both the terminator and the aptamer structures. The nucleotide U65 and the base pair U65-A95 are identified by a circle in the on state and by a rectangle in the off state, respectively. B, graphics representing the adenine and guanine aptamers. The sequence consensus of equivalent positions is shown for both the adenine and the guanine aptamers. The B consensus represents nucleotides C, G, and U, and the H consensus represents nucleotides A, C, and U. Consensus sequences were obtained here and from previous studies (14, 15). C, hydrogen bonding of G39 within the ligand binding site in the G39-C65 aptamer variant (16). Note that the variant adopts a very similar architecture when compared with the bound form of wild-type purine aptamers (11, 12).

