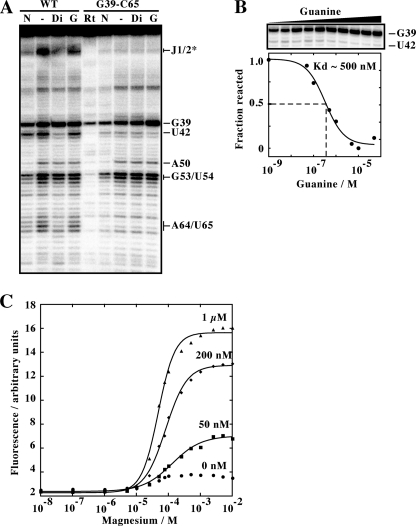
FIGURE 2.
A, SHAPE modification of the adenine aptamer and the related G39-C65 variant. Reactions were performed in the absence of ligand (−) or in the presence of 10 μm of 2,6-diaminopurine (Di) or guanine (G). Positions where NMIA reaction was observed are indicated on the right. N represents a reaction in which NMIA was substituted by dimethyl sulforide. Nucleotide identification is based on sequencing reactions as reported previously (32). The asterisk indicates a region assigned based on a previous study (32). Rt represents a primer extension performed using unreacted RNA. B, SHAPE modification of the G39-C65 variant as a function of the guanine concentration. The concentrations used are 0 nm, 1 nm, 10 nm, 50 nm, 0.1 μm, 0.5 μm, 1 μm, 5 μm, 10 μm, and 50 μm. A plot depicting the normalized fraction of reacted RNA versus the guanine concentration reveals an apparent Kd value of ∼500 nm, which is 100-fold higher than reported for the xpt guanine aptamer (8). C, plot of normalized 2AP fluorescence as a function of Mg2+ concentration. Titrations were performed at the indicated concentrations of adenine. Note that the observed change in the absence of adenine is not significant enough to allow informative data to be extracted from curve fitting.

