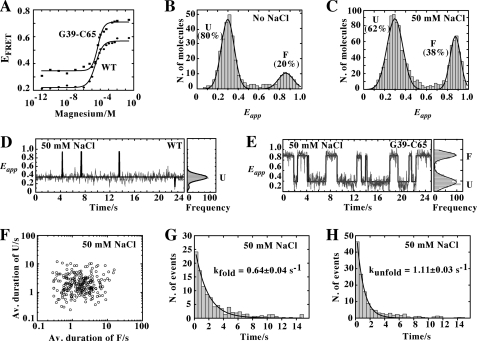
FIGURE 4.
A, variation in FRET efficiency as a function of Mg2+ concentration for the wild-type (circles) and the G39-C65 (squares) aptamers. The experimental data were fitted (lines) to a two-state model where the binding of ions to the aptamer induces loop-loop formation. B, single-molecule FRET histogram of the G39-C65 aptamer in the absence of NaCl showing two populations centered at Eapp ∼0.3 and Eapp ∼0.85 corresponding to the U and F states, respectively. The single-molecule histogram was fitted using a two-Gaussian model to extract the relative contribution of each population. C, single-molecule FRET histogram in the presence of 50 mm NaCl showing two populations with mean FRET values centered at Eapp ∼0.3 (U) and ∼0.85 (F). D, single-molecule FRET trajectories for the wild-type aptamer (33 ms of integration time) obtained at 50 mm NaCl showing that the aptamer remains most of the time in the U state with occasional short-lived fluctuations to the folded state F. Corresponding FRET histograms are shown on the right. E, single-molecule FRET trajectories for the G39-C65 aptamer obtained at 50 mm NaCl showing the interconversion between U and F states. F, scatter plot showing the average duration (Av. duration) of U and F states from 250 molecules at 50 mm NaCl. G and H, dwell time histograms of the unfolded (G) and folded state (H) in the presence of 50 mm NaCl. The data have been fitted to single-exponential decay functions to give the rates of folding (G) and unfolding (H).

