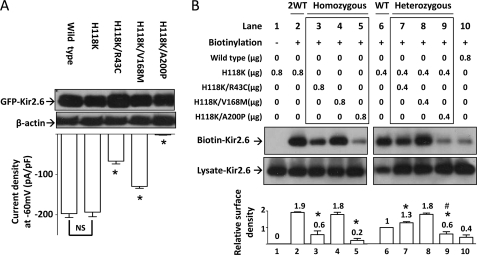
FIGURE 3.
Cell surface abundance of mutant Kir2.6 channels. A, shown is the effect of H118K mutation on wild type and three mutant Kir2.6 channels. Upper, protein expression of wild type and mutant Kir2.6 channels was detected by Western blotting analysis. β-Actin was used as a loading control. Lower, Kir2.6 inward current density at a holding potential −60 mV was measured and is presented as a bar graph (mean ± S.E., n ≥ 6 for each). The asterisk denotes p < 0.01 between H118-Kir2.6 and each double mutant channel. NS denotes not statistically significant. B, shown is the effect of three human Kir2.6 mutations on membrane abundance of channel. HEK cells were transfected with wild type and/or mutant Kir2.6 cDNAs (in μg of cDNA as indicated). 2WT (lane 2) and WT (lane 6) reflect the ratio of protein expression from two or single allele of KCNJ18, respectively. Homozygous (lane 3–5) and heterozygous groups (lane 7–9) (marked by a box) stand for homozygous mutation with two mutant alleles and heterozygous mutation with one mutant allele and one wild type allele, respectively. Lane 1 is a non-biotinylated group for negative control. Lane 10 shows low efficiency of the biotinylation reaction in wild type Kir2.6. Lysate-Kir2.6 and Biotin-Kir2.6 represent Kir2.6 channels in HEK cell lysates and in the eluate from a mixture of HEK cell lysates and streptavidin-agarose beads, respectively. The bar graph at the bottom is the relative surface density of Kir2.6 channel (normalized to lane 6). The mean ± S.E. from four separate experiments is shown on the top of each bar. Asterisks denote p < 0.01 each group versus lane 2. # denotes p < 0.01 in lane 9 versus lane 6. The gel shown is representative of four experiments with similar results. The abundance of each band in the gel was measured by densitometry by the Image J program available at the NIH website.

